Environment and Components of an Accounting Information System
Feedback Loop
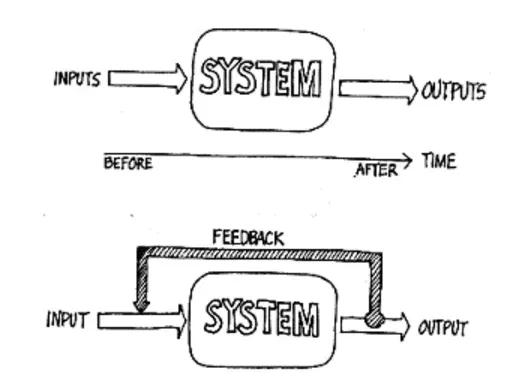
A feedback loop occurs when outputs are routed back as inputs, forming a chain of cause-and-effect. These loops help ensure continuous improvement. For a graphical example, refer to the image below.
Accounting Information System Mechanics
In accounting information systems, the process simplifies to an equation: Input → Process → Output. Input represents raw material with indirect utility. For instance, in vegetable soup production, vegetables in their raw form lack utility but gain value in the final product. Similarly, in accounting systems, data acts as the raw material.
Example of Individual Data Points
Consider a transaction at Macy’s Herald Square. Data points include the SKU number, quantity, color, cashier, and transaction time. Alone, a single data point offers limited utility but serves as an audit trail. For instance, verifying an unauthorized employee discount requires analyzing these data points.
Processes in Accounting Systems
The process in an accounting system transforms input into output. This process consists of multiple subprocesses. For example, an accounts payable system with a three-way match involves vendors sending invoices, which are matched to purchase orders. The project or property manager then verifies the goods and updates the system. This three-way match—between Purchase Order, Invoice, and Receipt Report—ensures accuracy in the Accounts Payable summary, crucial for budget management and effective business operations.
Output Examples
Output from an accounting system includes month-end trial balance reports, P&L/Income Statements, and Balance Sheets. Various items feed into the process to generate these outputs, which may sometimes require adjustments, such as for depreciation or mark-to-market items.
Feedback Loops in Quality Control
Once a process completes, if it’s repetitive, feedback loops become essential. A feedback loop involves Input → Process → Output → Sensor → Comparator → Activator → Input. The sensor measures the output, while the comparator compares it to an ideal model. The activator then triggers a response. For example, American Can used random can sampling to ensure quality control, a method now enhanced by technology to test every can.
Practical Applications
Feedback loops help in various industries. For instance, Ball Industries, the leading can producer in the U.S., tests every can for accuracy. Similarly, feedback loops have improved quality in potato chip production, eliminating undesirable products.
Data Utilization
Feedback loops generate data summarized in product utilization reports. For example, Macy’s might analyze white sweater sales to determine peak selling times and colors. This data informs strategies like adjusting inventory or pricing. In e-commerce, businesses may generate these summaries more frequently to respond swiftly to market changes.
For more insights on implementing or improving accounting information systems, contact us today. We offer expertise in optimizing feedback loops and data utilization to enhance your business processes.